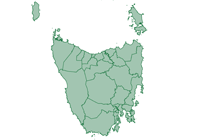
Current area:
Current benchmark:


| Gross Regional Product (GRP) | |||||||
|---|---|---|---|---|---|---|---|
| Burnie City | Tasmania | ||||||
| Year (ending June 30) | GRP $m | % change from previous year | Cumulative change | GRP $m | % change from previous year | Cumulative change | Burnie City as a % of Tasmania |
| 2023 | 1,790 | +2.94 | 179 | +38,611.80 | +1.16 | +174.87 | 4.64 |
| 2022 | 1,739 | +7.52 | 173 | +38,169.13 | +4.28 | +172.86 | 4.56 |
| 2021 | 1,617 | +3.77 | 161 | +36,602.25 | +4.73 | +165.77 | 4.42 |
| 2020 | 1,558 | -0.66 | 155 | +34,948.45 | +0.06 | +158.28 | 4.46 |
| 2019 | 1,569 | +4.17 | 157 | +34,926.77 | +3.70 | +158.18 | 4.49 |
| 2018 | 1,506 | +1.78 | 150 | +33,679.30 | +3.59 | +152.53 | 4.47 |
| 2017 | 1,480 | -0.69 | 148 | +32,511.27 | +1.46 | +147.24 | 4.55 |
| 2016 | 1,490 | +2.32 | 149 | +32,043.42 | +1.88 | +145.12 | 4.65 |
| 2015 | 1,456 | -0.66 | 145 | +31,453.38 | +1.18 | +142.45 | 4.63 |
| 2014 | 1,466 | -0.15 | 146 | +31,085.90 | +1.47 | +140.78 | 4.72 |
| 2013 | 1,468 | -5.00 | 146 | +30,635.65 | -0.60 | +138.75 | 4.79 |
| 2012 | 1,545 | +1.50 | 154 | +30,819.90 | +1.90 | +139.58 | 5.01 |
| 2011 | 1,522 | +0.67 | 152 | +30,246.31 | +2.37 | +136.98 | 5.03 |
| 2010 | 1,512 | -0.90 | 151 | +29,545.95 | +0.82 | +133.81 | 5.12 |
| 2009 | 1,526 | +1.00 | 152 | +29,305.34 | +2.82 | +132.72 | 5.21 |
| 2008 | 1,511 | +0.46 | 151 | +28,501.04 | +4.19 | +129.08 | 5.30 |
| 2007 | 1,504 | +5.42 | 150 | +27,354.18 | +2.55 | +123.88 | 5.50 |
| 2006 | 1,427 | +10.11 | 142 | +26,675.02 | +3.86 | +120.81 | 5.35 |
| 2005 | 1,296 | +5.66 | 129 | +25,683.01 | +2.55 | +116.32 | 5.04 |
| 2004 | 1,226 | +7.99 | 122 | +25,043.33 | +4.99 | +113.42 | 4.90 |
| 2003 | 1,135 | +8.07 | 113 | +23,853.89 | +2.72 | +108.03 | 4.76 |
| 2002 | 1,051 | +4.83 | 105 | +23,221.65 | +5.17 | +105.17 | 4.52 |
| 2001 | 1,002 | -- | 100 | +22,080.49 | -- | +100.00 | 4.54 |
Source: National Institute of Economic and Industry Research (NIEIR) ©2024. Compiled and presented in economy.id by .id (informed decisions). Please refer to specific data notes for more information | |||||||
