
There are different ways of measuring the employment of an area, all of which give an insight into the local economy and its growth rate over time. They are:
| Employment summary | |||||||||
|---|---|---|---|---|---|---|---|---|---|
| City of Melbourne | 2021/22 | 2020/21 | 2015/16 | Change | |||||
| Employment Types | Number | Number | Number | 2015/16 - 2020/21 | |||||
| NIEIR Local Jobs | 605,671 | 582,346 | 514,909 | +67,437 | |||||
| ABS Census Employment Counts | - | 503,044 | 436,751 | +66,293 | |||||
| CLUE On-Site Jobs | 480,576 | 468,648 | 453,453 | +15,195 | |||||
Source: National Institute of Economic and Industry Research (NIEIR) ©2023, Australian Bureau of Statistics,Census of Population and Housing 2021, City of Melbourne. Compiled and presented by .id (informed decisions). Please refer to specific data notes for more information | |||||||||
This page outlines the key uses of each collection; how the collections differ; and explains why the statistics produced in each of these collections are not directly comparable.
ABS employment counts
The ABS Census counts people where they work in the week before the Census (the most recent census was 10 August 2021). The ABS Census employment count provides a rich snapshot about worker characteristics like hours worked, income, age structure, occupation by industry and field of qualification by industry. However, it undercounts ABS’ official labour force estimate (issued in August 2021 at a state level) by around 15%. Additionally, as the census is only conducted once every five years, ABS Census counts can become outdated between Census collections. The data is collected on a location basis, providing insight on the spatial distribution of employment.
NIEIR local jobs
NIEIR local jobs data addresses some of the limitations of the ABS Census count and Labour force data with estimates of workers at the LGA level. NIEIR undertakes microsimulation modelling with a range of data inputs to allocate the missing 15 per cent of jobs to an LGA. This means that the NIEIR local job estimate can be compared to the ABS labour force estimate, allocating all workers to a local government area on a place of work basis. NIEIR local jobs can be used for benchmarking and comparing local government areas across Australia to each other, or to their state totals. NIEIR local jobs is also a key input into estimating the economic value and can be used in economic impact modelling.
CLUE on-site jobs
Census of Land Use and Employment (CLUE), or CLUE on-site jobs, is collected by the City of Melbourne through contact with and visits to individual businesses occupying commercial or institutional space in the municipality. Data collected includes businesses, jobs, industry (ANZSIC) structure, floor space and its use, and building information. Data collection occurs on an ongoing basis, and is reported annually with data for the entire municipality since 2002. The data is collected on a location basis, providing insight on the spatial distribution of ‘on-site’ jobs and floor space use within the municipality.
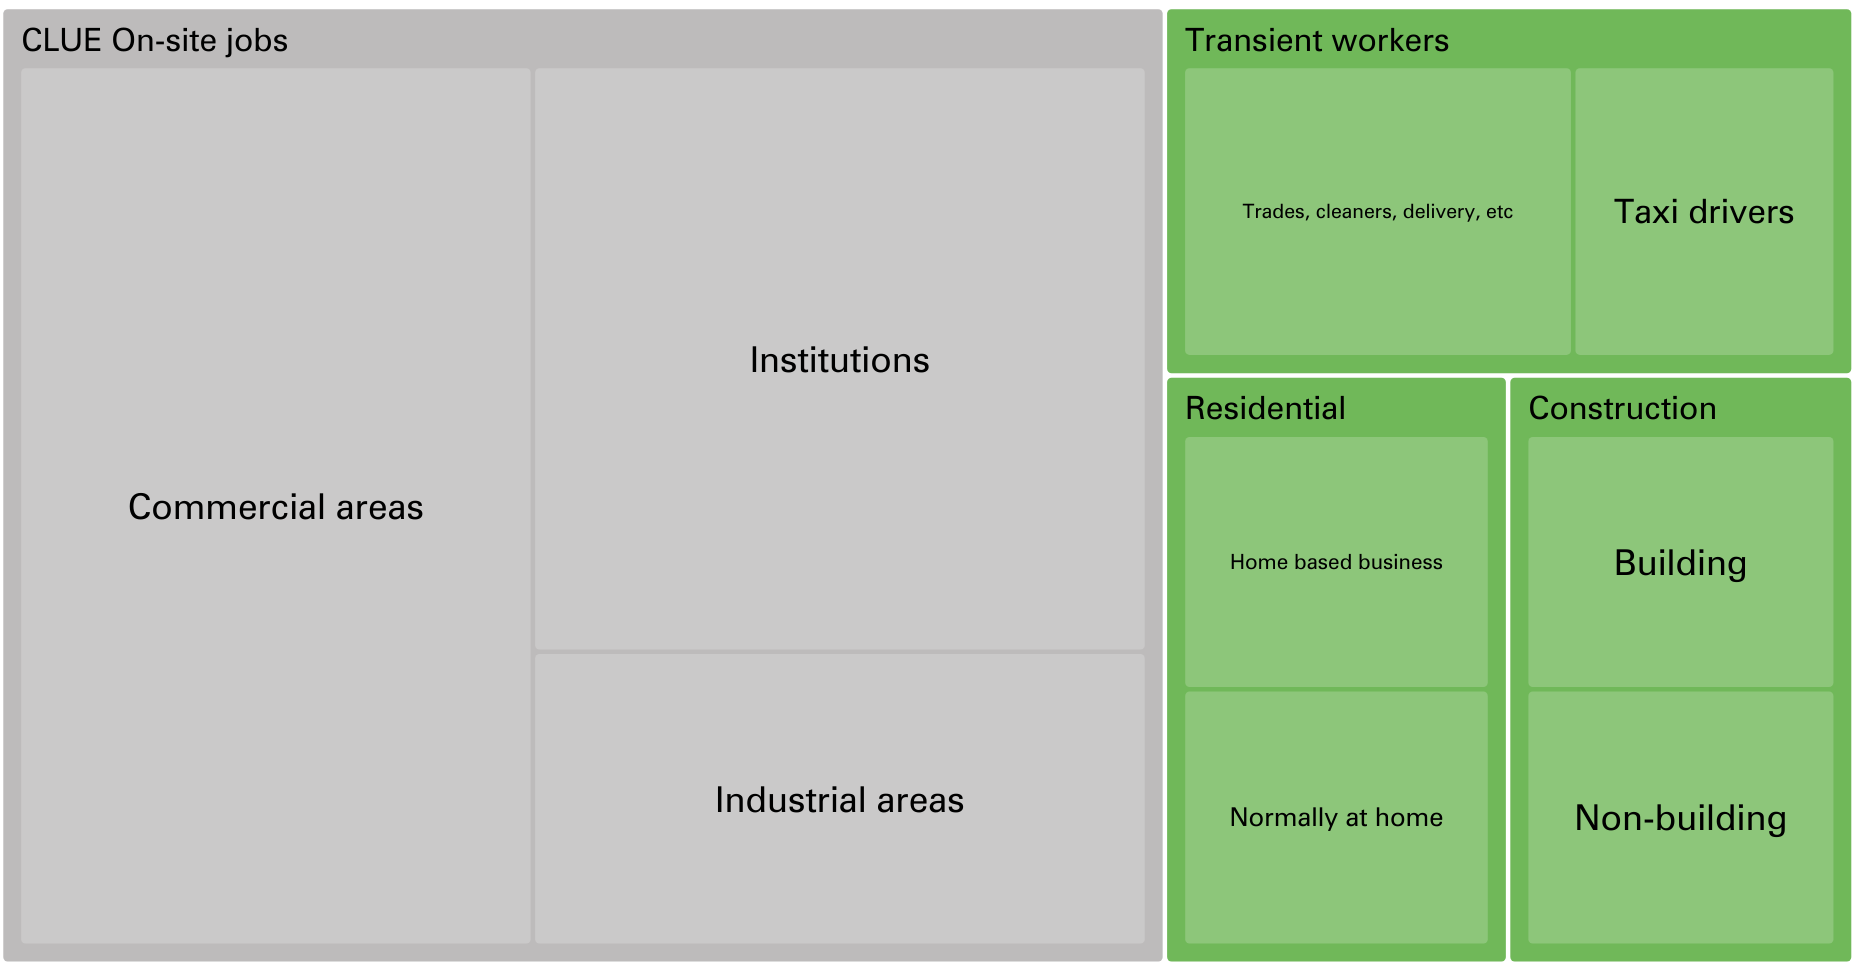
Since the basis for CLUE data collection is businesses with a location in the City of Melbourne, some types of employment are not counted or are underrepresented in CLUE data. This includes construction jobs located at construction sites, transient workers such as taxi drivers or trades people, home-based businesses or workers. Additionally, the City of Melbourne is one of few local governments in Australia that collects its own employment and land use data in this way, limiting the ability to compare to other municipalities using this data source.
CLUE on-site jobs focuses on businesses operating within commercial and institutional spaces within the municipality. These areas represent both the focus for economic development efforts (investment attraction, public realm improvement, activation projects, clusters, etc.) and the domains where the Council exerts the most control (planning, infrastructure investment). By providing unparalleled insight into these specific areas, CLUE On-Site Jobs allows the CoM to effectively monitor and optimise its economic development initiatives.
Summary of differences between datasets
Each of these datasets has different strengths and the most appropriate dataset will depend on the use case. Some of these considerations are outlined below.
| Theme | Census employment counts | NIEIR local jobs (modelled) | CLUE ‘on-site’ jobs |
|---|---|---|---|
| Geography | Good for understanding worker characteristics at a small area geography | Presented on economy.id at the LGA level. | Provides detailed industry and location (subLGA) business and job data at a hyper-local geography |
| Coverage | National dataset, captures where worker journeyed to and from for work | National dataset, benchmarked to ABS official estimates of employment, allowing the ability to compare a LGA to other benchmark areas. Addresses the under-count of Census employment counts making comparisons more accurate. | City of Melbourne only |
| Reference period | The week prior to the Census Night. | The average over the financial year. | Information is collected from businesses over the year. |
| Benchmarking | Compare and benchmark to other local government areas across Australia. Has limitations due to industry undercounts. | Compare and benchmark to other local government areas across Australia | Can benchmark areas within City of Melbourne. But unable to compare a LGA with another benchmark area. |
| Scope | Underestimates official labour force estimates | Limited detail about worker characteristics. Scope is the same as the ABS Labour Force Survey. Good for counting workers to understand employment. Local jobs data is based on employer's usual workplace address. People working at home (temporary or hybrid) will be allocated to their workplace address as opposed to their home address. | ‘on-site’ jobs or jobs in businesses occupying commercial or institutional space in the municipality. Includes data about land and floor space use and change. Doesn’t count some transient and temporary jobs (e.g. taxi drivers, construction site workers). Doesn’t count home-based businesses or jobs. |
| Time Series | Time series analysis limited to census years only. Most recent data is from 2021 so shows COVID impact, but not recovery. | Good for time series analysis (annual and quarterly) | Good for time series analysis (updated annually) |
When to use the different datasets
- If you need to know the total employment in a particular industry, use NIEIR
- If you need to know the employment change by industry, use NIEIR
- If you need to compare employment to other local government areas or state benchmarks, use NIEIR
- If you need an estimate of total workers in the City of Melbourne, including those that work transiently or from home, use NIEIR.
- If you need to breakdown very detailed industry subgroupings, use CLUE.
- If you need to know about employment located in fixed commercial premises in the City of Melbourne, use CLUE
- If you need to understand businesses, land use and jobs in different parts of the municipality, use CLUE.
- If you need to understand floor space in the context of future forecasts in the City of Melbourne, use CLUE.
- If you need to compare the demographic characteristics of the workers in different industries, use Census counts of employment
- If you need to compare residents employed to those who commute out, use Census counts of employment